 [ Home Page - Surveys - Documents - Presentations - Search ]
The NMAP project [1] was funded under the JISC 05/99 call for proposals to create the UK's gateway to high quality Internet resources for nurses, midwives and the allied health professions.
NMAP is part of the BIOME Service, the health and life science component of the national Resource Discovery Network (RDN), and closely integrated with the existing OMNI gateway. Internet resources relevant to the NMAP target audiences are identified and evaluated using the BIOME Evaluation Guidelines. If resources meet the criteria they are described and indexed and included in the database.
NMAP is a partnership led by the University of Nottingham with the University of Sheffield and Royal College of Nursing (RCN). Participation has also been encouraged from several professional bodies representing practitioners in these areas. The NMAP team have also been closely involved with the professional portals of the National electronic Library for Health (NeLH).
The NMAP service went live in April 2001 with 500 records. The service was actively promoted in various journal, newsletters, etc. and presentations or demonstrations were given at various conference and meetings. Extensive use was made of electronic communication, including mailing lists and newsgroups for promotion.
Work in the second year of the project included the creation of two VTS tutorials: the Internet for Nursing, Midwifery and Health Visiting, and the Internet for Allied Health.
As one of the indicators of the success, or otherwise, in reaching the target group we wanted to know how often the NMAP service was being used, and ideally who they are and how they are using it.
The idea was to attempt to ensure we were meeting their needs, and also gain data which would help us to obtain further funding for the continuation of the service after the end of project funding.
There seems to be little standardisation of the ways in which this sort of data is collected or reported, and although we could monitor our own Web server, the use of caching and proxy servers makes it very difficult to analyse how many times the information contained within NMAP is being used or where the users are coming from.
These difficulties in the collection and reporting of usage data have been recognised elsewhere, particularly by publishers of electronic journals who may be charging for access. An international group has now been set up to consider these issues under the title of project COUNTER [2] which has issued a "Code of Practice" on Web usage statistics. In addition QA Focus has published a briefing document on this subject [3].
We took a variety of approaches to try to collect some meaningful data. The first and most obvious of these is log files from the server which were produced monthly and gave a mass of data including:
A small section of one of the log files showing the general summary for November 2002 can be seen below. Note that figures in parentheses refer to the 7-day period ending 30-Nov-2002 23:59.
Successful requests: 162,910 (39,771)
Average successful requests per day: 5,430 (5,681)
Successful requests for pages: 162,222 (39,619)
Average successful requests for pages per day: 5,407 (5,659)
Failed requests: 2,042 (402)
Redirected requests: 16,514 (3,679)
Distinct files requested: 3,395 (3,217)
Unwanted logfile entries: 51,131
Data transferred: 6.786 Gbytes (1.727 Gbytes)
Average data transferred per day: 231.653 Mbytes (252.701 Mbytes)
A graph of the pages served can be seen in Figure 1.
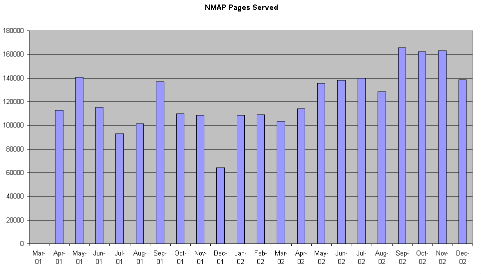
Figure 1: Pages served per month
The log files also provided some interesting data on the geographical locations and services used by those accessing the NMAP service.
Listing domains, sorted by the amount of traffic, example from December 2002, showing those over 1%.
| Requests | % bytes | Domain |
| 48237 | 31.59% | .com (Commercial) |
| 40533 | 28.49% | [unresolved numerical addresses] |
| 32325 | 24.75% | .uk (United Kingdom) |
| 14360 | 8.52% | ac.uk |
| 8670 | 7.29% | nhs.uk |
| 8811 | 7.76% | .net (Network) |
| 1511 | 1.15% | .edu (USA Educational) |
A second approach was to see how many other sites were linking to the NMAP front page URL. AltaVista was used as it probably had the largest collection back in 2000 although this has now been overtaken by Google. A search was conducted each month using the syntax: link:http://nmap.ac.uk and the results can be seen in Figure 2.
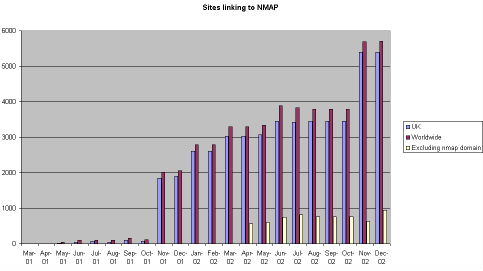
Figure 2 - Number of sites linking to NMAP (according to AltaVista)
The free version of the service provided by InternetSeer [4] was also used. This service checks a URL every hour and will send an email to one or more email addresses saying if the site is unavailable. This service also provides a weekly summary by email which, along with the advertising includes a report in the format:
========================================
Weekly Summary Report
========================================
http://nmap.ac.uk
Total Outages: 0.00
Total time on error: 00:00
Percent Uptime: 100.0
Average Connect time*: 0.13
Outages- the number of times we were unable to access this URL
Time on Error- the total time this URL was not available (hr:min)
% Uptime- the percentage this URL was available for the day
Connect Time- the average time in seconds to connect to this URL
During the second year of the project we also conducted an online questionnaire with 671 users providing data about themselves, why they used NMAP and their thoughts on its usefulness or otherwise, however this is beyond the scope of this case study and is being reported elsewhere.
Although these techniques provided some useful trend data about the usage of the NMAP service there are a series of inaccuracies, partly due to the nature of the Internet, and some of the tools used.
The server log files are produced monthly (a couple of days in areas) and initially included requests from the robots used by search engines, these were later removed from the figures. The resolution of the domains was also a problem with 28% listed as "unresolved numerical addresses" which gives no indication where the users is accessing from. In addition it is not possible to tell whether .net or .com users are in the UK or elsewhere. The number of accesses from .uk domains was encouraging and specifically those from .ac & .nhs domains. It is also likely (from data gathered in our user questionnaire) that many of the .net or .com users are students or staff in higher or further education or NHS staff who accessing the NMAP service via a commercial ISP from home.
In addition during the first part of 2002 we wrote two tutorials for the RDN Virtual Training Suite (VTS) [5], which were hosted on the BIOME server and showed up in the number of accesses. These were moved in the later part of 2002 to the server at ILRT in Bristol and therefore no longer appear in the log files. It has not yet been possible to get access figures for the tutorials.
The "caching" of pages by ISPs and within .ac.uk and .nhs.uk servers does mean faster access for users but probably means that the number of users in undercounted in the log files.
The use of AltaVista "reverse lookup" to find out who was linking to the NMAP domain was also problematic. This database is infrequently updated which accounts from the jumps seen in Figure 2. Initially when we saw a large increase in November 2001 we thought this was due to our publicity activity and later realised that this was because it included internal links within the NMAP domain in this figure, therefore from April 2002 we collected another figure which excluded internal links linking to self.
None of these techniques can measure the number of times the records from within NMAP are being used at the BIOME or RDN levels of JISC services. In addition we have not been able to get regular data on the number of searches from within the NeLH professional portals which include an RDNi search box [6] to NMAP.
In the light of our experience with the NMAP project we recommend that there is a clear strategy to attempt to measure usage and gain some sort of profile of users of any similar service.
I would definitely use Google rather than AltaVista and would try to specify what is needed from log files at the outset. Other services have used user registration and therefore profiles and cookies to track usage patterns and all of these are worthy of consideration.
 Rod Ward
Lecturer, School of Nursing and Midwifery,
University of Sheffield
Winter St.
Sheffield
S3 7ND
Email: Rod.Ward@sheffield.ac.uk
Also via the BIOME Office:
Greenfield Medical Library
Queen's Medical Centre,
Nottingham NG7 2UH
Email: rw@biome.ac.uk
[ Home Page - Surveys - Documents - Presentations - Search ]

Web page by Brian Kelly of UKOLN.
Last Modified 29-May-2005
Email comments to webmaster@ukoln.ac.uk
QA Focus Comments
Citation Details
Gathering Usage Statistics and Performance Indicators: The NMAP Experience, Ward, R., QA Focus case study 06, UKOLN,
<http://www.ukoln.ac.uk/qa-focus/documents/case-studies/case-study-06/>
This document was published on 8th January 2003.